
.svg)


How a dessert can radically alter our relationship to data

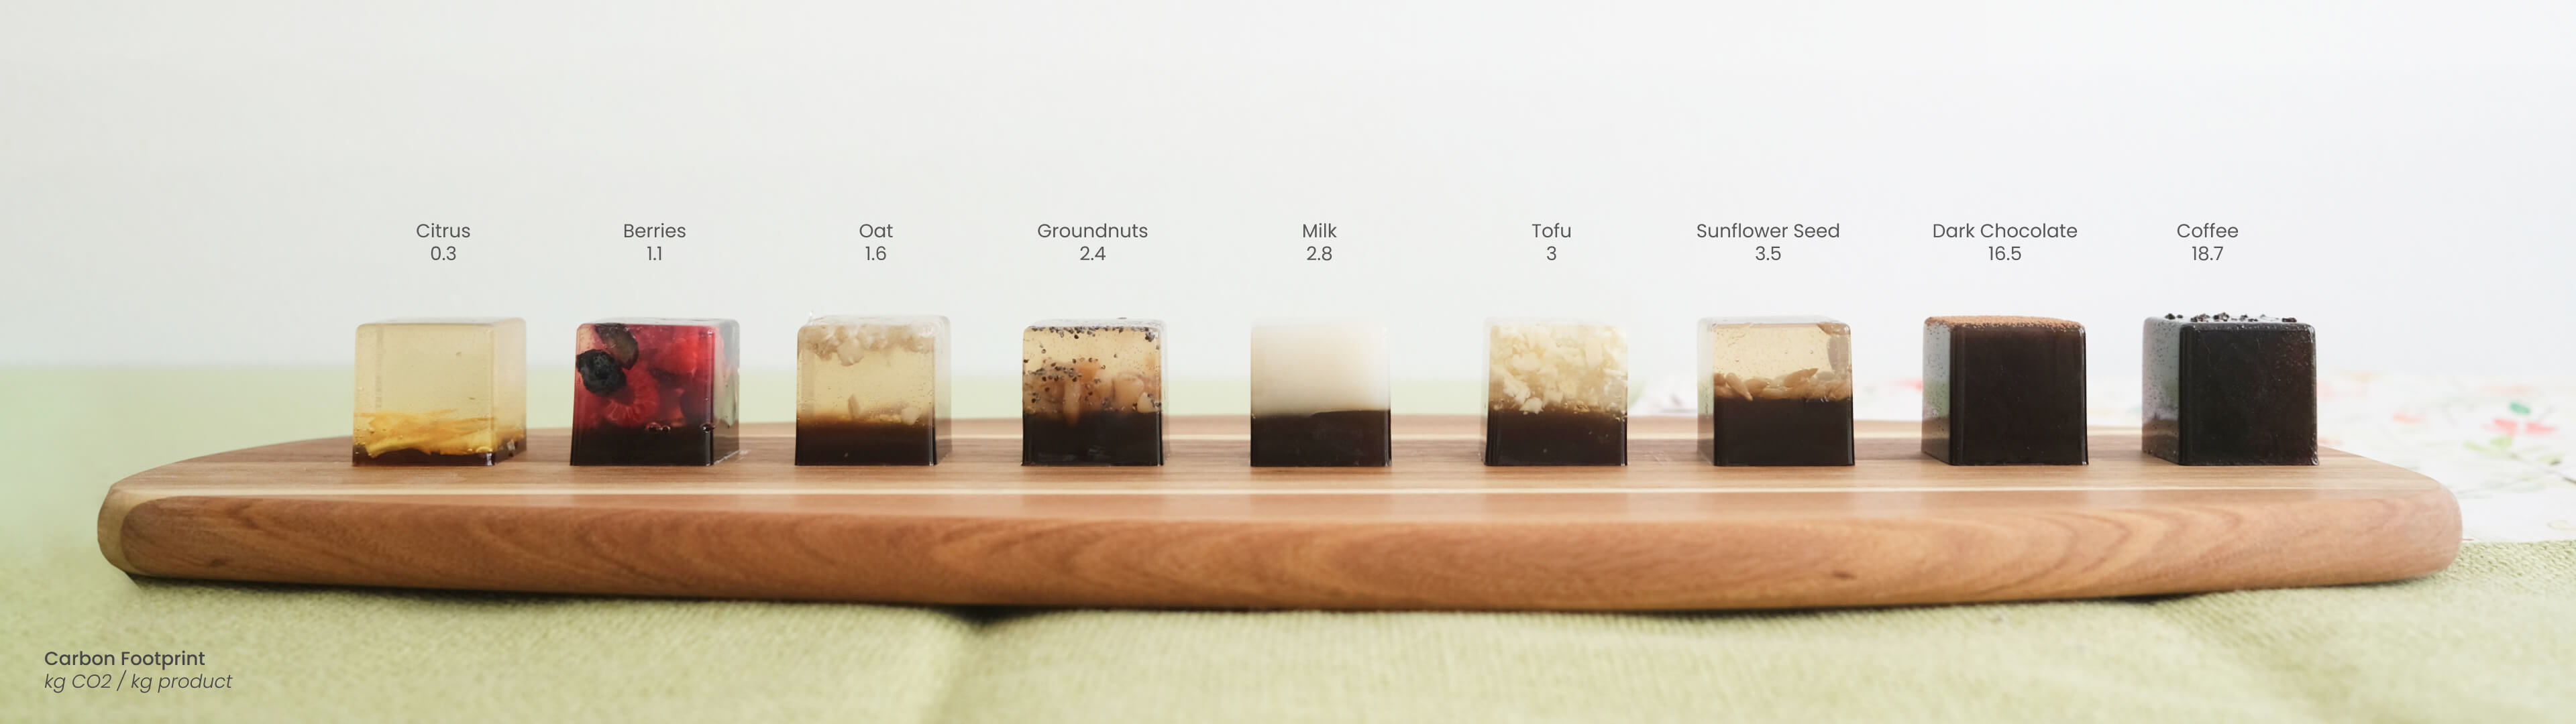
Picture this: You walk into your favorite coffee shop, check out the desserts, and choose which one to order based on its carbon footprint—just by looking at the confection itself.
Wagashi is a traditional Japanese dessert considered to embody a microcosm of time, space, and nature, typically made of agar, water, and sugar. In this coffee shop, each dessert features a main ingredient—berries, citrus, chocolate—that determines its primary flavor, with an added twist: the addition of a layer of coffee, which corresponds to the carbon footprint associated with producing this main ingredient. The higher the carbon footprint, the higher the level of coffee in the dessert, and the more bitter it tastes. You can see and taste it.
Making Data Feel Real
This is the concept behind DataWagashi, the design-tech project I collaborated on with Boston-based design technologist Iyang Huang. DataWagashi invites people to experience the future of data communication by bringing climate data to life through all the senses. We go beyond traditional visuals by incorporating taste, smell, texture, and physical interaction, expanding the vocabulary for how we understand and interact with data. With DataWagashi, data transforms from numbers on a screen to a vivd and engaging multisensory journey.

Fighting Data Fatigue
In today's world, the constant doom and gloom surrounding climate change can make it feel overwhelming and disconnected from our daily lives. The complexity of climate data, which is often presented through numbers, charts, and preaching, only adds to this detachment, making the information hard to relate to our senses and emotions. We wanted to find a new, better way to raise awareness about these important issues, and make data communication more intuitive, enjoyable, and fun. So we turned to food, a universally-loved and relatable medium, to make complex environmental data more accessible, foster empathy, and empower people to make better choices. But food is just one of many creative media we can use to overcome data fatigue and craft engaging data stories through design.

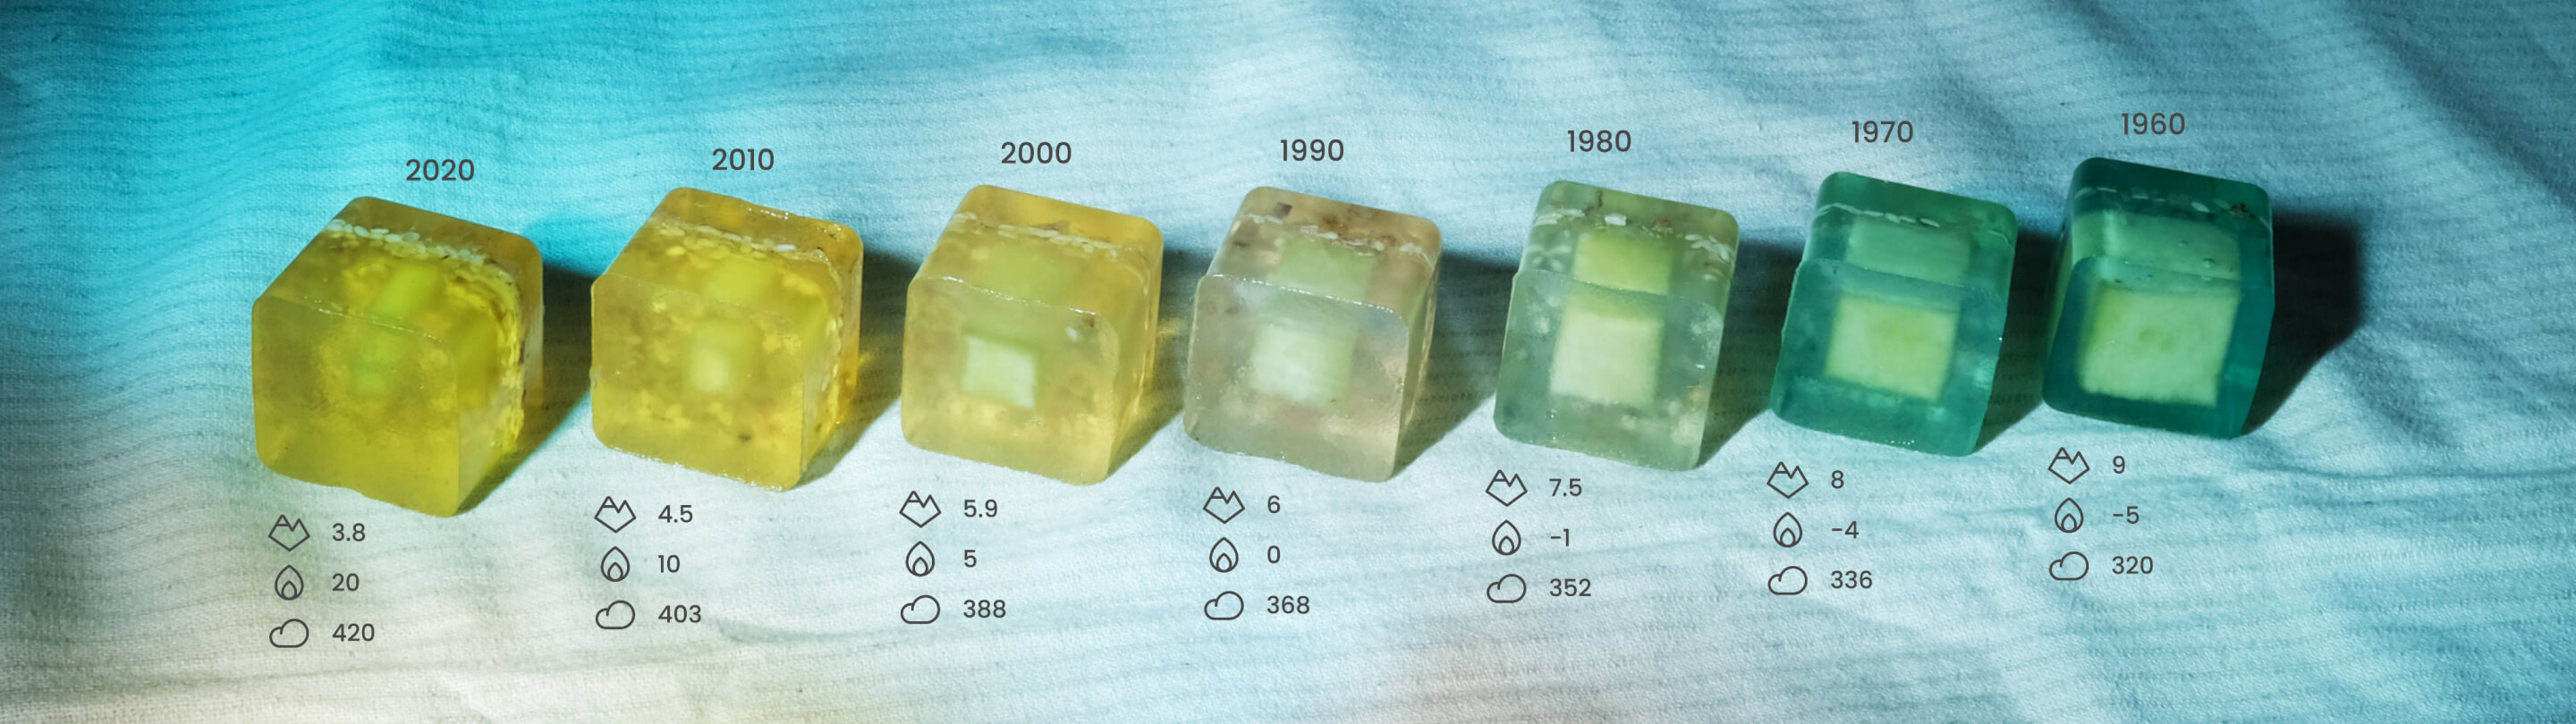
One way we can think about changing how we present information is by transforming text-based information into something capable of carrying multimodal information—like edible objects, but also, sounds, lights, responsive wearables, and much more. Instead of just making a deck that tells people there has been a 20-degree sea water temperature increase, why not design a way for people to directly feel the difference? Imagine experiencing wildfires not through statistics, but by tasting the severity of raging flames through a range of spicy dishes, hearing the before and after of dwindling forest chorus, and touching the roughness of the scorched grass. By physicalizing data, we translate numbers back into experiences that can be seen, touched, and felt, connecting more deeply with the real world.
Introducing the Phygital Experience
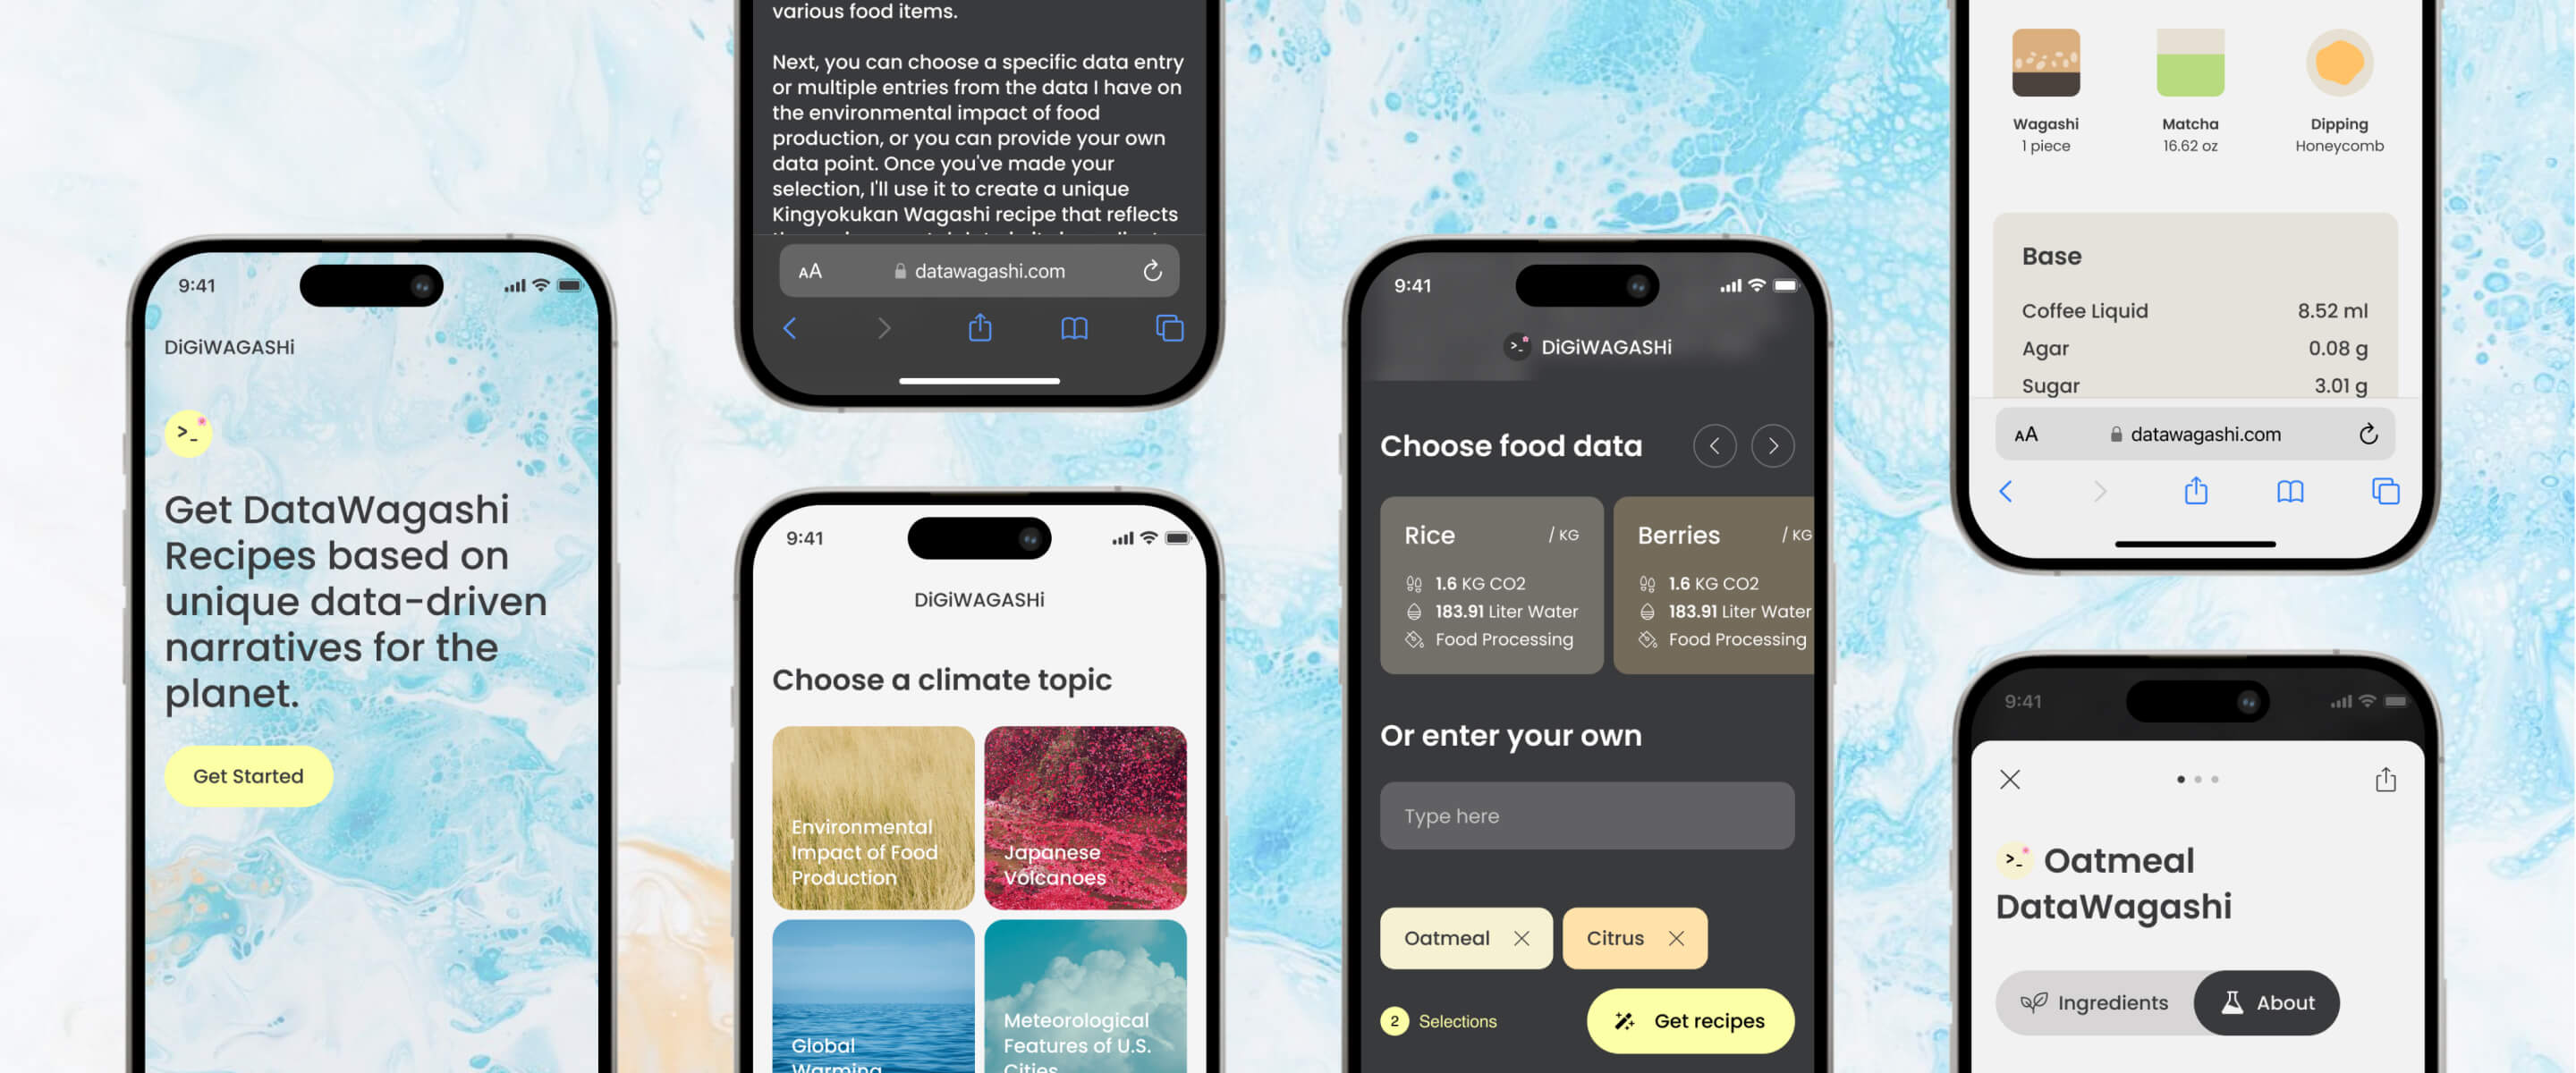
The integration of Generative AI into storytelling introduces a new blend across digital and physical platforms, enabling us to transform large-scale datasets into tangible Wagashi forms. Setting up a few lines of mapping rules allows the data—whether static, real-time, or customized by user input—to dynamically manifest across multiple formats such as graphics, text, sound, and food, bridging the gap between digital information and physical entities. These entities could be data-driven recipes, playlists that shift with real-time data trends, algorithmically-woven textiles, ambience gadgets that adapt to environmental changes, and vending machines that dispense data-inspired poems on bamboo paper, making abstract data interactively tangible.
This approach opens up various real-world use cases and applications in everyday lives, from creating customized dessert recipes and generating climate sonatas to sending personalized gift packages.
The importance of data empathy
DataWagashi is also about democratizing data. By turning data into physical, sensory experiences, we can break down information barriers, ensuring that people with varying data literacy levels can grasp the complex concepts and join in on conversations about climate change and environmental impact. This redesign of data presentation fosters understanding among diverse groups across ages, cultures, and professional training, creating a fair environment for dialogue and learning, and making the intricate world of data an experience open to all.
Soon, you might walk into your favorite cafe and order desserts not by ingredients, but by picking up a menu called "Biodiversity Forecast in 60 years," and choosing from "Rainforest," "Desert," or "Ocean." Maybe you’ll have a weekly smoothie subscription that alters its formula based on a synthesis of the average air quality (climate data) and how active you are (personal health tracking data). The next day, a box of unique foods arrives, driven by your data choices, offering delightful surprises. This not only gives you a tasty treat but also connects you to a bigger data story, inspiring awareness and action.
Heading to SXSW 2024? Meet up with us at DataWagashi: Feeling Climate Data through New Design Medium, and learn more about how we can make the data tangible in the most flavorful way for a better climate future.
Words and art

Subscribe