
.svg)


Time to Burst Your Research Bubble
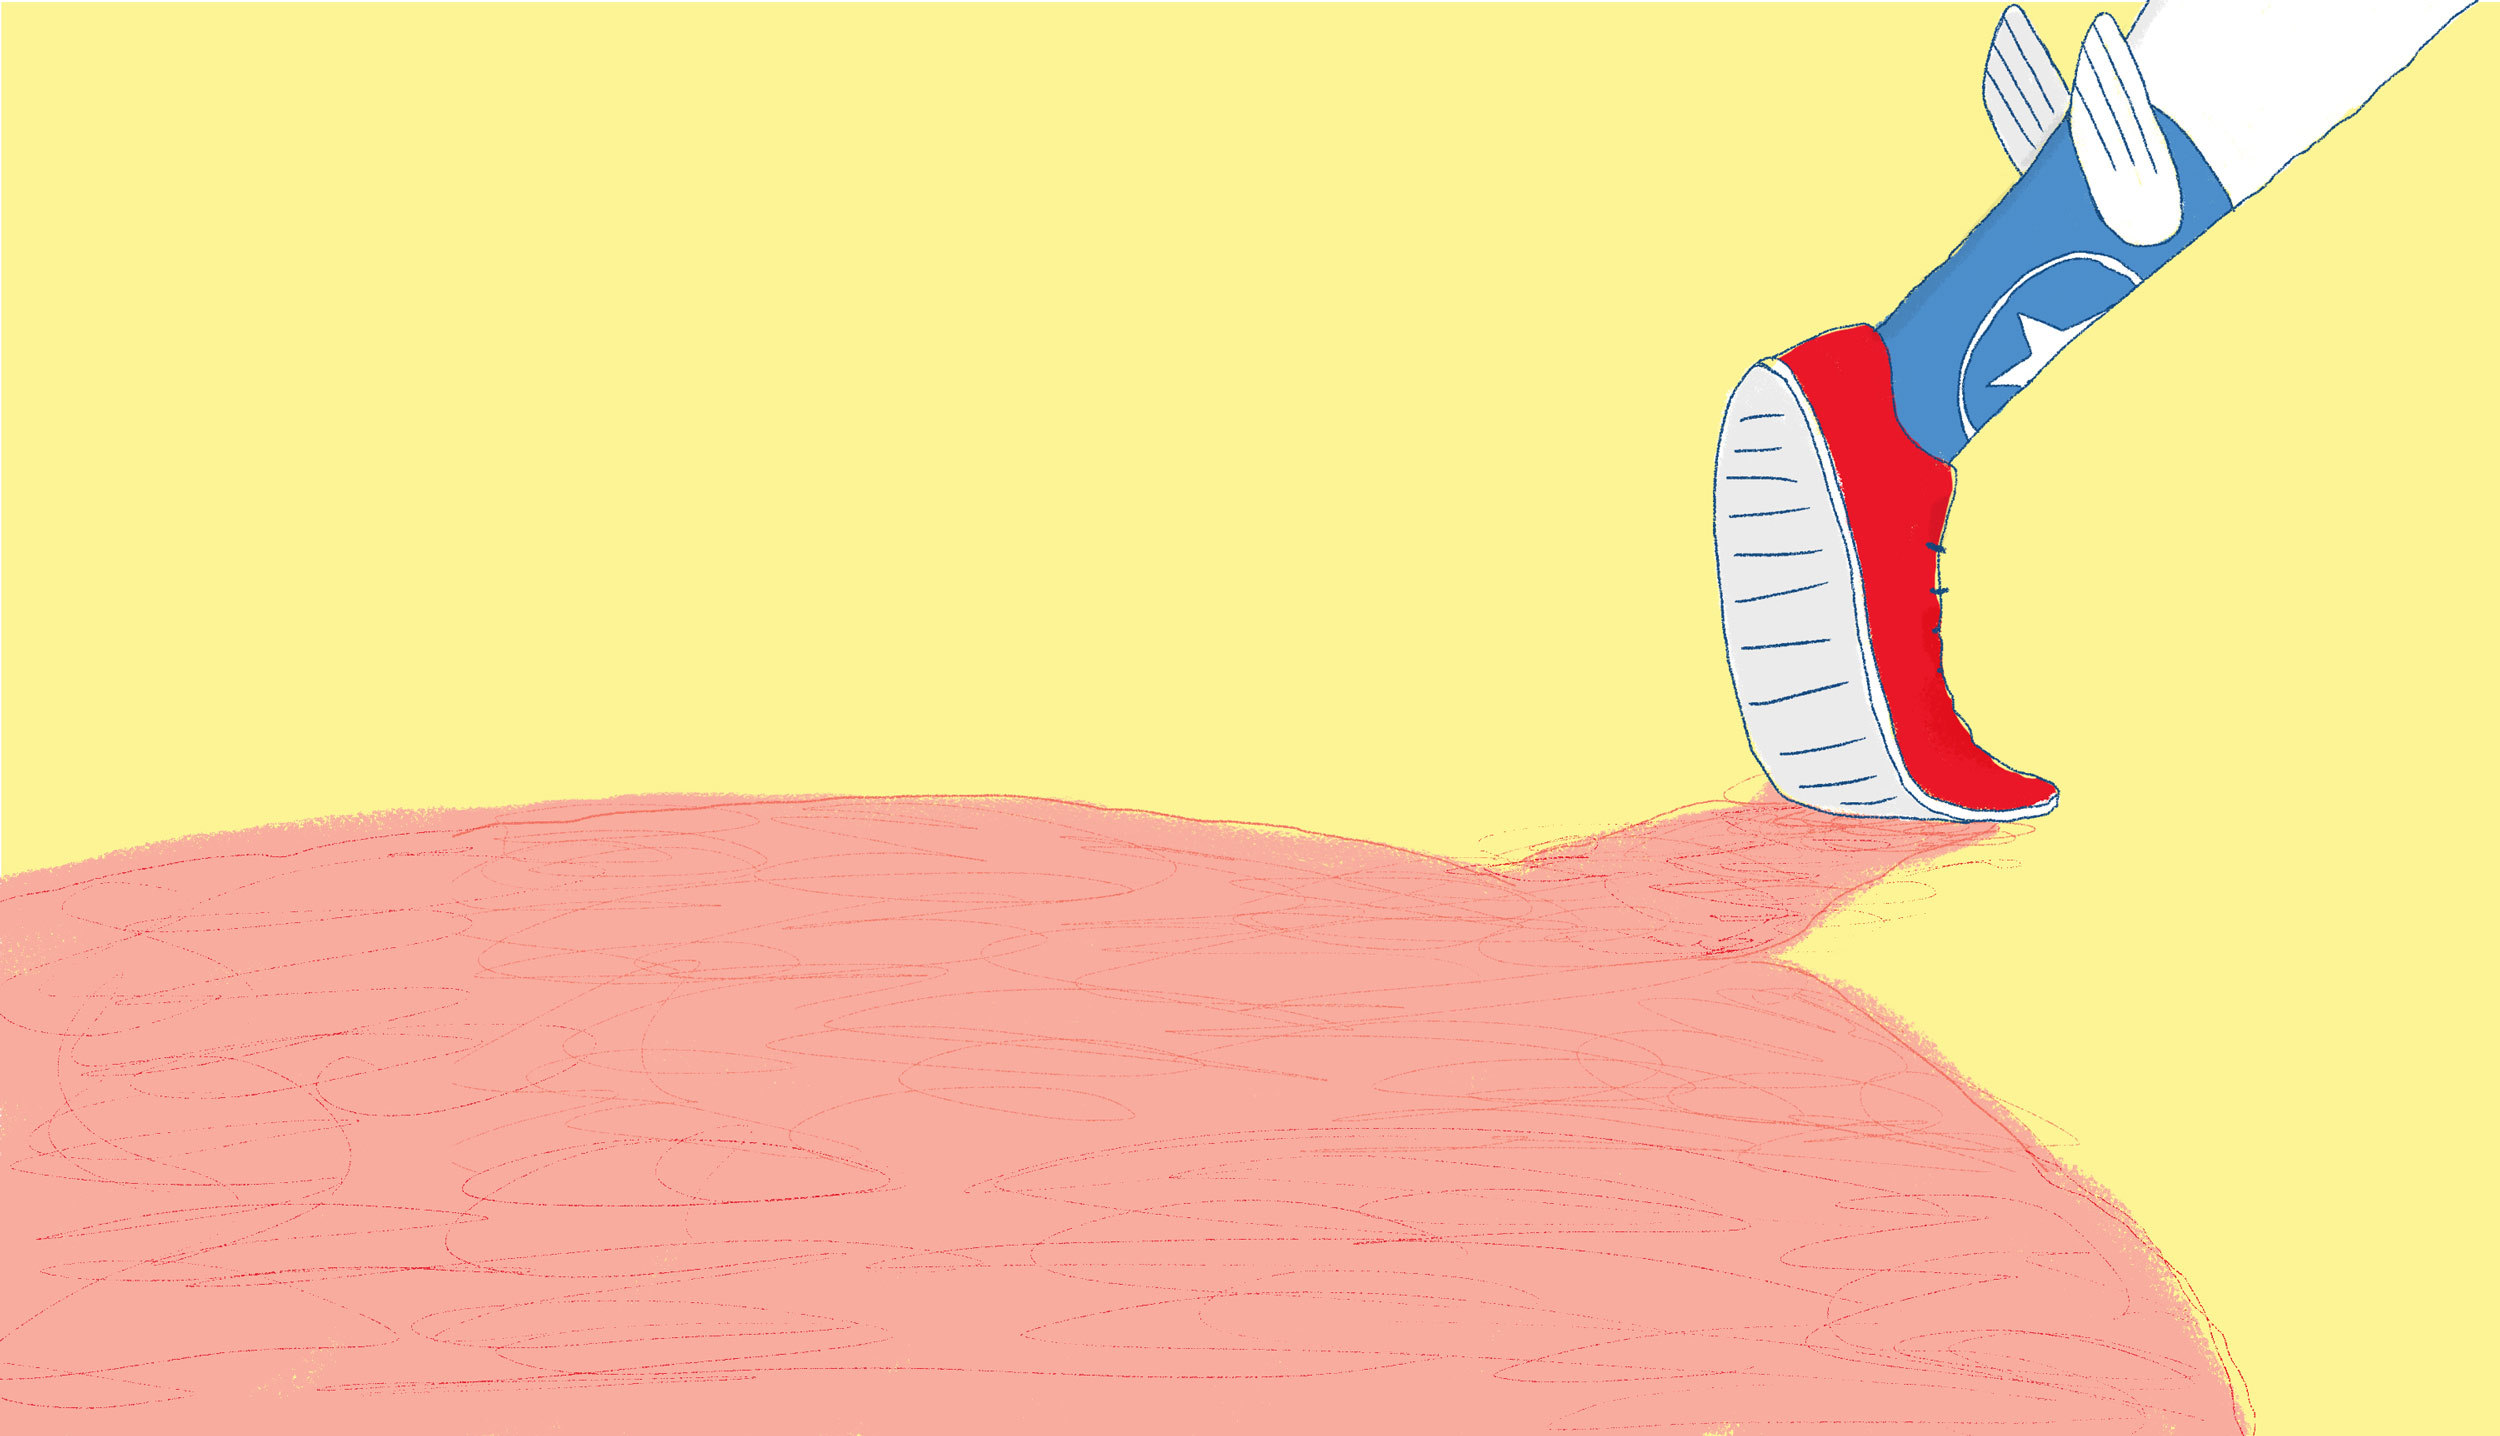
At IDEO, we take listening pretty seriously. That means talking to people who are outside of our comfort zone. That said, in my years conducting design research interviews, I’ve found that our targets fit a certain profile: Coastal. Millennial. Liberal. Globally-minded.
From a business perspective, I can appreciate why this demographic is appealing. It makes economic sense to consider a customer segment primed to understand the company's proposed product or service.
But limiting research to the East and West Coasts is exclusionary, and can even be discriminatory. Following recent events in our national story, there’s been a lot of chatter about ignorance—about a hidden America. And this isn’t just our problem: Events like Brexit, the Catalonian referendum, and the rise of populism at large all point to the need to address different perspectives. The context has shifted, and it’s our responsibility to respond.
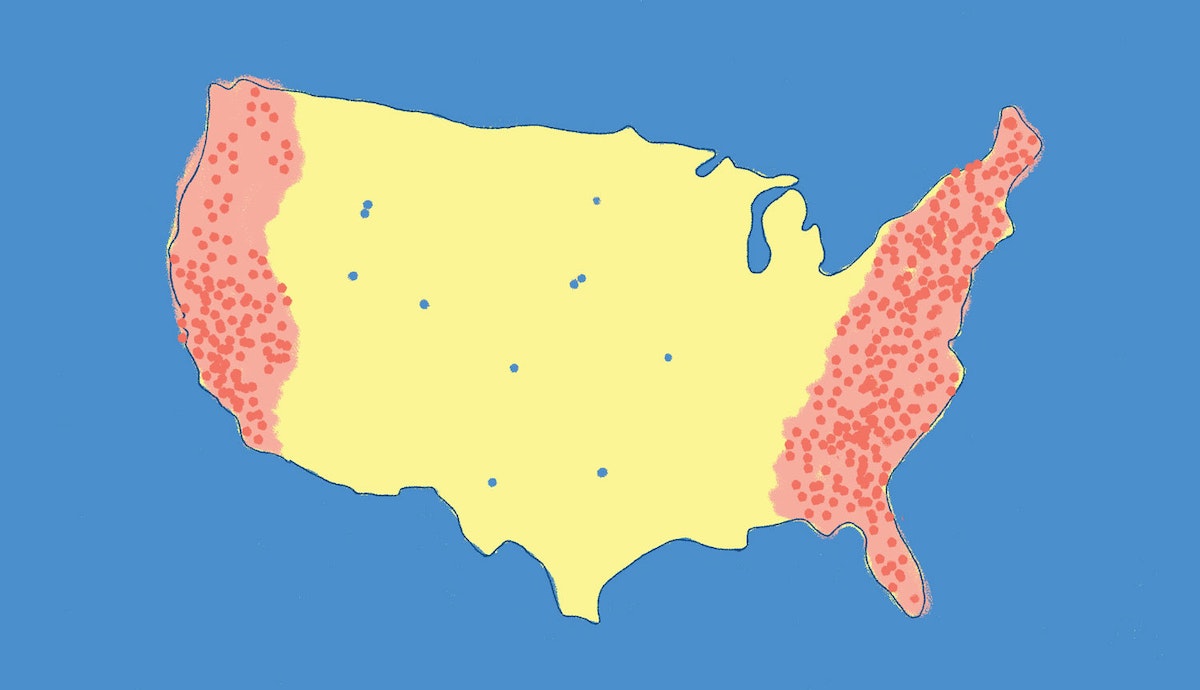
So, a Cambridge-based team of designers decided to do something about it. We know that addressing geographic bias begins by identifying your blind spots, so to kick things off, my colleague Graham Gardner helped us prototype a simple yet elegant solution: a data-rich Google Map.
For every engagement, we document where the team conducts research and upload this information to the map. It’s the first step in visualizing hotspots, as well as potential design research deserts. Just seeing the spread of icons across the country helps teams realize if their sample population is skewed or appropriately representative.
Mapping is a simple hack that keeps teams accountable, and it’s easy to do yourself. Here's how:
- While signed into your Google account, open the “My Maps” page on Google Maps.
- Click on Create a new map in the upper-left corner.
- Click on Untitled map and give your new map a name, for example, “Design Research Phase 1".
- Search for the addresses of locations you’ve selected for your research.
- Click + Add to map to create a marker at that location.
- Zoom out to see a birds-eye view of your research plan.
It’s that easy. And it’s incredibly effective.
Maps motivate action. This isn’t a revolutionary perspective. Organizations across the globe use maps to identify blind spots in their work. Consider the USDA’s Food Access Research Atlas (designed to prompt policymakers to close the gap to healthy foods) or the New York Times’ powerful piece on "Mapping Segregation," which was intended to spark dialogue about systemic segregation.
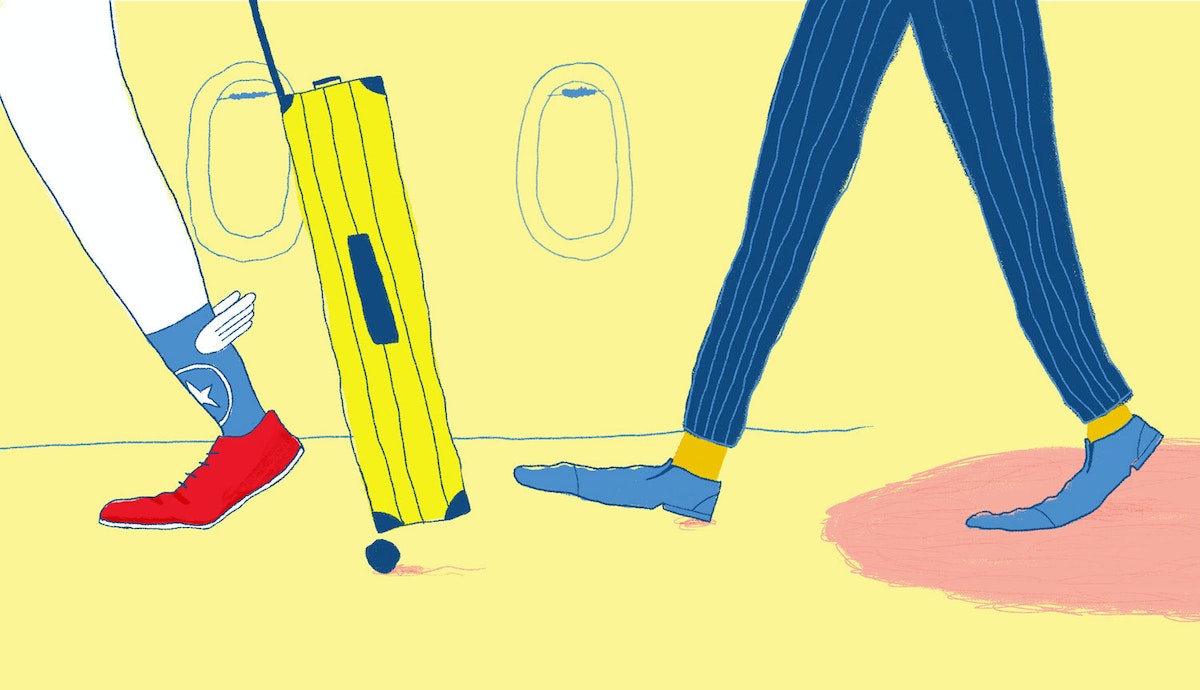
Now, we're designing ways to burst our own design research bubble, and I’ve already begun to notice some changes. On a recent client engagement, we revised our plan and suggested a few days of research in Kansas and Missouri, instead of just Boston.
To our delight, the client loved the idea. Two weeks later, we were on a flight to Kansas City. While there, we noticed the importance of community relationships in a much stronger way than we did at home base. This pushed us to reconsider how we incorporated community advice into our final product design.
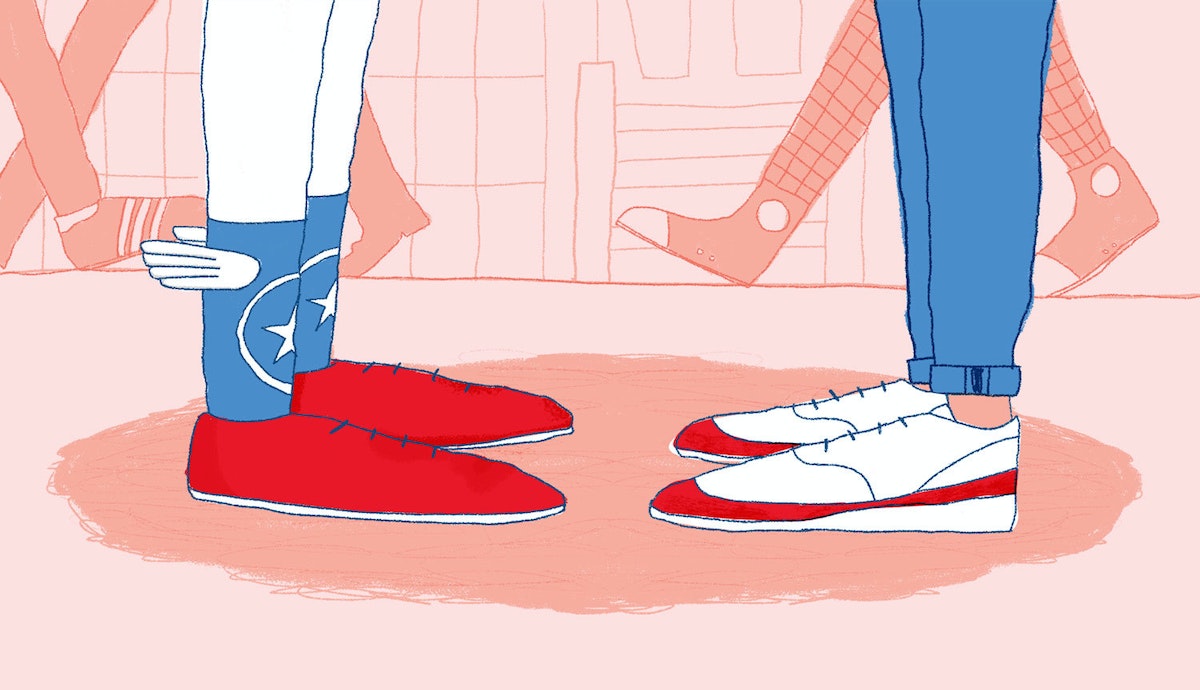
Inclusive, forward-thinking design doesn’t mean replicating what works well or feels right in our backyard. It means getting out there, dialing up your inner listener, and sitting down with someone completely unlike you. Your perspective will never be the same.
Words and art

Subscribe